I teach various Microsoft
software; Word, Publisher, PowerPoint, Access, and Excel. Each has value in the workplace depending on
the tasks that need to be completed. Of
the five, however, I find that intermediate to advanced knowledge of Access and
Excel is like having money in the bank.
The ability to manage large data sets in this “age of data” is a crucial
skill to develop. In this posting, I
will demonstrate how to use Excel to manage a dataset from the Federal Bureau
of Investigation’s Uniform Crime Report.
The Uniform Crime Report is a list of offenses known to law enforcement
that is reported by municipalities each year.
Part of the UCR is broken down by state, allowing users to select and
download individual states for analysis.
In this example, I am using New Jersey’s 2010 UCR data.
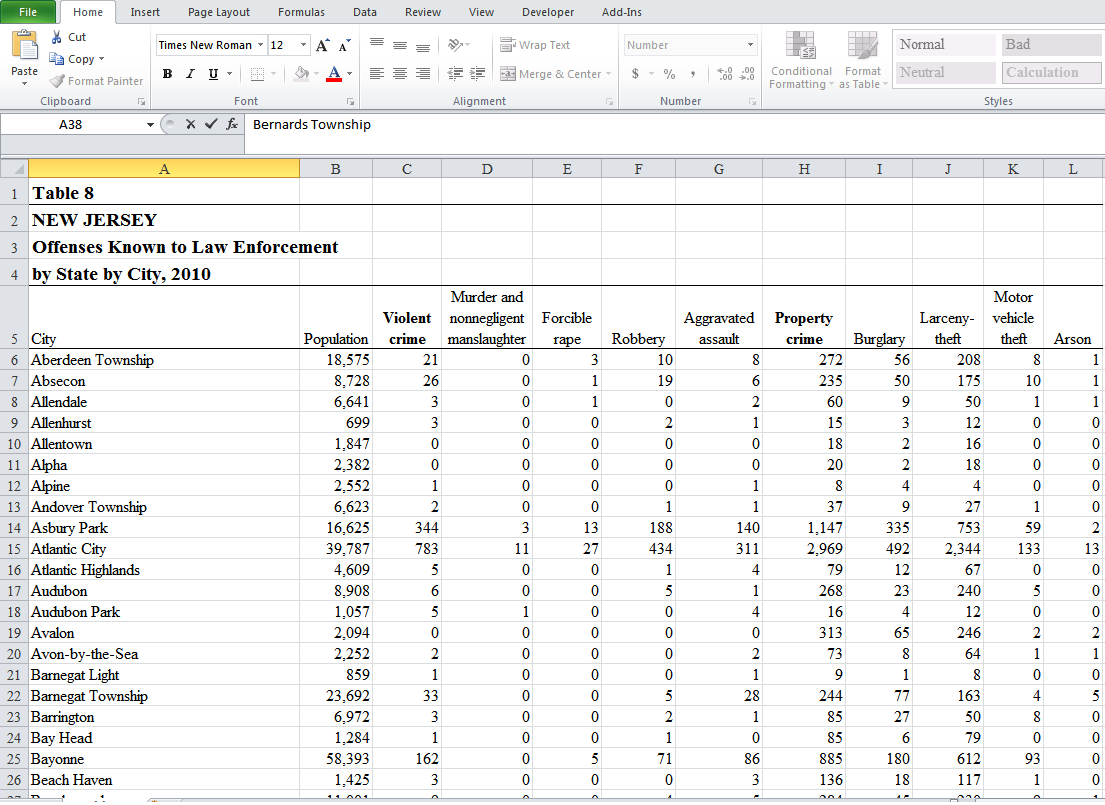
The dataset contains 493 cities and towns.
A complete record for each town is represented
in the rows.
There are 12 categories of
information including the city name and categories of crime.
These categories are contained in the
columns.
The first thing you may notice when attempting to browse the sheet is that it is quite easy to lose your place. In the screenshot, what does the value 146 in cell H38 represent? Of course I can scroll back and over to the beginning of the spreadsheet and find that the H column reflects property crime, and Row 38 reflects Bernards Township.
An easy way to keep column headings and row labels in view all the time while scrolling the data is to use the freeze pane option. In this example, the cells I want to freeze are located above and to the left of cell B6. I highlight the cell, select View-> Freeze Panes-> Freeze Panes. Now when I browse the sheet, the column headings and row labels stay in view.
Even with the spreadsheet easier to scroll through, finding specific data can still be a cumbersome task. For example, suppose I want to review crimes for New Jersey’s 4 most populated cities. I could employ Excel’s Sort and Filter option by selecting the Population column and then selecting Sort & Filter. I would have to repeat the steps to sort other categories. A downside of this method is that it changes the layout of the spreadsheet.
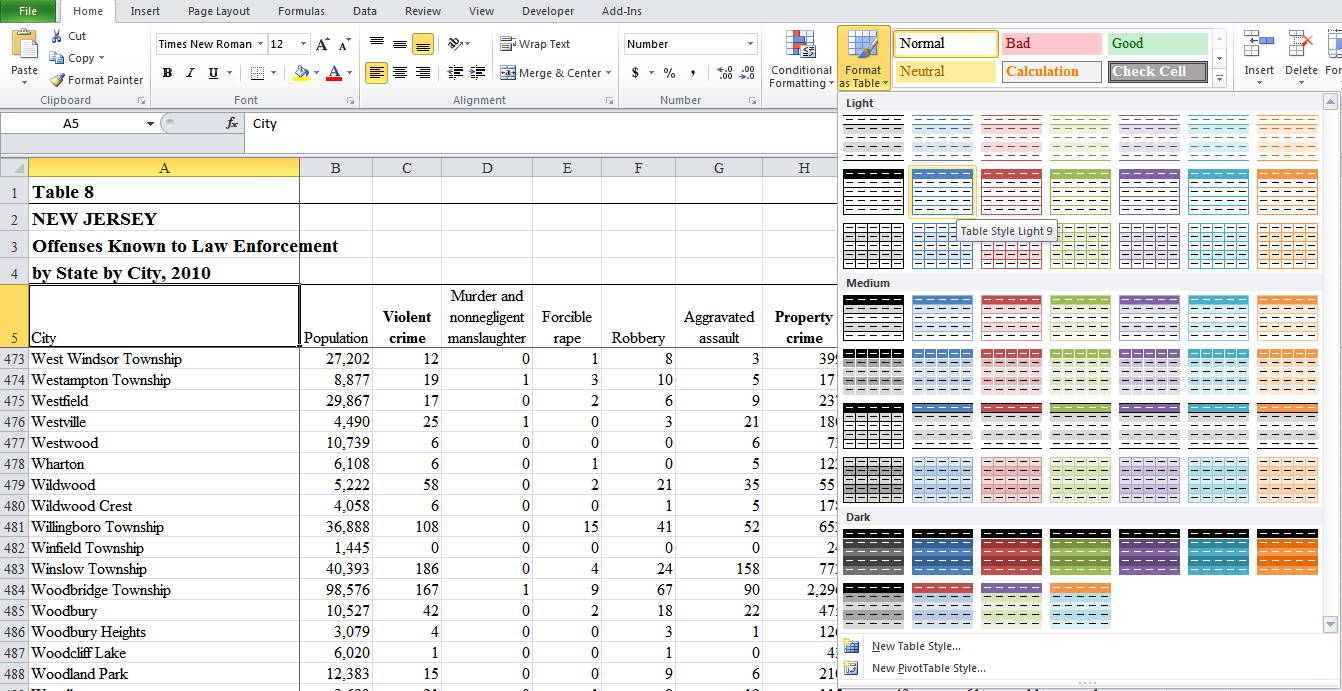
A better option for data management in this case format the data as a
table. I click on cell A5, select Format as Table, and select a color
scheme. The Format as Table dialog box appears. I will have to change
the data range from $A$1 to $A$5 since the actual data starts in cell
A5. I also have to check “my table has headers” since each column
heading represents a category of data. My data is formatted into a
table with filter control boxes for each column.
Using the filter control boxes, I can perform specific searches based on data criteria. For example, perhaps I want to see a list of cities where the violent crimes were 100 or lower. I select the arrow in the violent crime column and select number filters. Notice the number filtering option available. I will use the less than or equal to filter. I set the criteria as 100 and I am presented with a list of towns
and cities where the reported violent crimes were 100 or less.
These results can then be sorted largest to smallest or smallest to largest. Another useful number filter is the Top 10 filter, although the title of this filter can be misleading. Not only can you filter for a top 10, you can also filter for the bottom 10, as well as change the min/max value and whether to search by items or percentages.
When I demonstrate these techniques in class, many students assume that data is deleted. However, filtering data hides those data that do not meet the criteria. No data is deleted. Removing the filter makes all data visible again. A filter can be removed by clicking on the arrow in the column and selecting Select All.
One of Excel’s most recognized
user features is the software’s power of calculation, from basic mathematical
functions to advanced statistical functions. I like to convert data to
tables whenever feasible because it allows me to append a total row to my table.
The total row gives me access to all of Excels functions with the click of the
mouse. By highlighting any cell in my table, selecting Table Tools and
Design and clicking Total Row, a total row is added to the end of the
table. For example, summing the population column, I can see that the
total population in this data set is 8,439,459. While the SUM function is
a commonly used tool, each column has a total cell with all of Excels functions
available for use.